In the third article about benchmarking caching libraries it is finally time for a benchmark scenario which stresses the caches in different aspects. Also, we will analyse whether the different approaches to eviction in cache2k have any negative effects and whether their implementation is robust and of production quality (spoiler: Yes, it is!).
Impatient readers can skip to the Conclusion.
In the rest of the article the following points are discussed:
- Two benchmark scenarios which use different cache eviction algorithms.
- Memory consumption and comparison between the sizes of jar files for different implementations.
Table of contents
Open Table of contents
Benchmark Setup
Benchmark code is available in the GitHub project cache2k benchmark.
Environment
- JDK: Oracle Version JDK 1.8.0_131, VM 25.131-b11
- JVM flags:
-server -Xmx10G -XX:BiasedLockingStartupDelay=0(with and without-XX:+UseG1GC) - JMH Version: 1.18
- CPU: Intel(R) Xeon(R) CPU E3-1240 v5 @ 3.50GHz, 4 physical cores
- CPU L1 cache: 4 x 32 KB 8-way set associative instruction caches, 4 x 32 KB 8-way set associative data caches
- CPU L2 cache: 4 x 256 KB 4-way set associative caches
- CPU L3 cache: 8 MB 16-way set associative shared cache
- RAM: 32GB total, 2x16GB DRR4 at 2133 MHz
- OS: Ubuntu 14.04
- Kernel: 4.4.0-57-generic
Compared Caches and Versions
We will compare cache2k with these ‘cache’ implementations:
- Google Guava Cache, Version 20
- Caffeine, Version 2.5.2
- cache2k, Version 1.0.0.Final
- EHCache, Version 2.10.3
JMH Setup
The JMH command line arguments -f 2 -wi 5 -w 30s -i 3 -r 30s result in:
- Forks: 2 (2 runs in a newly started JVM)
- Warmup: 5 iterations, 30 seconds each
- Measurement: 3 iterations, 30 seconds each
Five warmup iterations of 30 seconds each lead to 2:30 minutes of warmup. A longer warmup is needed especially for the benchmark runs with large heap sizes (10M cache entries) to allow the garbage collector to adapt and have steadier behaviour.
Threads and Cores
The number of threads is equal to the number of cores available to the JVM. To disable cores we can use the
Linux CPU hotplug feature. This way only enabled processors are exposed by the OS and the output of
the Java method Runtime.getRuntime().availableProcessors() is equal to the number of usable physical
processor cores. No hyperthreading is in effect.
Plots Units and Confidence
In the plots below, units are in SI (base 10), which means 1MB is 10^6 bytes. This ensures the unit prefixes for operations/s and bytes/s are the same.
Every bar has a confidence interval associated with it. This interval does not just represent the upper and lower bounds of a measured value, but shows a range of potential values. The confidence interval is calculated by JMH with a level of 99.9% (which means the likelihood that the actual value is within the shown interval is 99.9%).
A Comprehensive Benchmark
Part 1 of the series focused on comparing cache implementations to hash maps, in which case the test scenario did not trigger eviction, while Part 2 focused on benchmarking different eviction algorithms. Both benchmarks were designed to test two different aspects of caching in isolation and they have given interesting insights into detailed aspects.
However, the outcome may be totally different in other scenarios, such as when concurrent threads utilise the eviction algorithm as opposed to only one thread as in Part 2.
We have combined a few such aspects into one benchmark:
- A skewed access pattern via the Zipfian distribution to utilise the cache eviction algorithm
- Different key space sizes, yielding different hit rates
- A cache miss gets a significant penalty by burning a defined amount of CPU cycles
- Read through operation, which is commonly used but may result in additional blocking overhead
The access pattern is artificially generated via the so-called Zipfian distribution. This access pattern represents a simulation of a skewed sequence typically found in applications these days. The Zipfian distribution is widely used for benchmarking key/value stores. The algorithm was originally described in “Quickly Generating Billion-Record Synthetic Databases”, Jim Gray et al, SIGMOD 1994.
In a few other cache benchmarks, the access sequence and key objects are calculated in advance, so that the benchmark
only covers the performance of the cache access. This approach was tested in different variations but proved to be problematic
in a few cases. If the sequence is too small, eviction algorithms can adapt to it and show unrealistically high hit rates.
Furthermore, a separate sequence is needed for each thread. To avoid any adaptation effects on repetition, the sequences
must be much longer than the cache size. Big cache sizes in the benchmark are around 10 million entries, which makes this infeasible.
The best solution for this proved to be the online generation of the access sequence. The Zipfian generator implementation
from the Yahoo! YCSB benchmark was improved for fast and low overhead generation by replacing the random number generator used with the fast random sequence generator XorShift1024StarRandomGenerator of the DSI utilities. This means
the sequence generation and the creation of the integer objects for the cache keys are included in the performance measurements.
The Zipfian sequence is used in variations to yield different cache hit rates. Zipfian factor 10 signifies the generation of a key number space 10 times bigger than the cache size. A certain Zipfian factor yields approximately the same hit rate for different cache sizes.
The cache operates in read through mode. A cache miss results in a call to a cache loader, which adds a penalty by burning CPU cycles
via JMH’s black hole: Blackhole.consumeCPU(1000). Other benchmarks use Thread.sleep(10) (or something similar)
to sleep for 10 milliseconds and simulate I/O latency. Using Thread.sleep() for such a small time may result in inconsistency.
Such code would be impacted by the operating system scheduler.
Benchmark source file: ZipfianSequenceLoadingBenchmark.java.
Whiskers show the 99.9 % confidence interval reported by JMH.
CPU profiling with a cache size of 1M and Zipfian factor 10, 4 threads and cache2k shows that 35% of the CPU cycles are spent in the black hole. If this time were used for the loader, hit rates of the cache implementations would improve. As explained before, the throughput is also determined by the speed of the random number generator. Benchmarking the random number generator and the generation of the integer keys alone results in 23 million operations per second for the CMS collector and 13 million operations per second for the G1 collector. Interpreting the graph and concluding that the fastest cache is about 50% faster than its competitor would be wrong (cache2k vs. Caffeine with 100K entries), since the benchmark code itself has a significant overhead. Comparing only the time spent in the cache code, the performance difference would be bigger.
Let’s look at the achieved hit rates:
Whiskers show the 99.9 % confidence interval reported by JMH.
Caffeine and cache2k have significantly higher hit rates by about 4%, cache2k is slightly better than Caffeine by about 0.15%.
Another benchmark is analysed with different numbers of threads and CPU cores. As explained earlier, the number of available CPU cores is equal to the number of benchmark threads.
Let’s look at the results for one, two and four cores:
Whiskers show the 99.9 % confidence interval reported by JMH.
EHCache2 does not scale well in this scenario with the additional cores, which is probably caused by additional locking overhead in the blocking read through configuration.
Caffeine has low performance with one or two cores but better performance with four cores. This is most likely caused by the fact that Caffeine uses multiple threads for the eviction. With one or a few cores available, the inter thread communication produces overhead and causes delays.
By varying the size of the Zipfian distribution we can yield different hit rates. The chart below shows the performance with different Zipfian factors:
Whiskers show the 99.9 % confidence interval reported by JMH.
The corresponding effective hit rates per cache are:
Whiskers show the 99.9 % confidence interval reported by JMH.
cache2k is optimised in such a way that there is minimal overhead at high hit rates. A few processes are delayed as long as possible until eviction. That’s why the relative advantage of cache2k becomes smaller for lower hit rates.
We also analysed another benchmark run with the new G1 collector. Let’s look at the first statistic with a different collector implementation:
Whiskers show the 99.9 % confidence interval reported by JMH.
With a cache size of around 1M entries cache2k profits highly from its low allocation rates. All other cache implementations have a higher allocation rate, resulting in lower throughput. With a cache size of 10M, cache2k and Guava face a higher loss, because with this cache size these two cache implementations cause more work for G1 than the other implementations. In the next benchmark, this impact becomes even more visible.
Worst Case Eviction Performance
cache2k uses an eviction algorithm which may have different performance outcomes depending on the access sequence. We will analyse another benchmark to check the most unfavourable working conditions. This is to make sure that there are no unexpected drawbacks when used in varying production scenarios.
cache2k uses the eviction algorithm Clock-Pro (described in USENIX’05: “CLOCK-Pro: An Effective Improvement of the CLOCK Replacement”), which scans through a circular list of entries (the clock) for an eviction candidate. This algorithm has a theoretical worst case performance of O(n), which means eviction performance will decrease linearly with the number of cached items. cache2k incorporates the following changes to improve eviction efficiency and worst case runtime:
- A reference counter is used instead of a reference bit
- An adaptive threshold based on the access frequency is used to search for an eviction candidate
- Separate clocks are used for hot and cold entries and the entry order in the hot working set is reshuffled according to the recent references
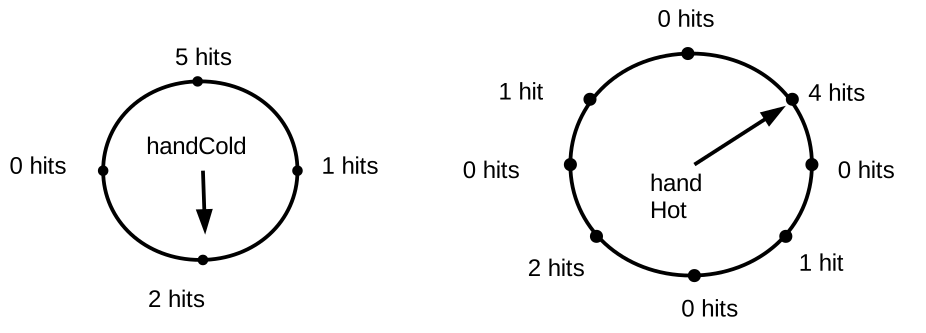
Nevertheless, the question of the theoretical categorisation of O(n) remains. However, the theoretical big-O notation only means there is no mathematical proof that the worst case performance is in a better big-O category. Theory gives us an indication that the worst case performance may be a problem, so what does it look like in practice? Let’s quote Richard P. Feynman: It doesn’t matter how beautiful your theory is, it doesn’t matter how smart you are. If it doesn’t agree with experiment, it’s wrong. One prominent example where the theoretical performance does not match the practical performance is the QuickSort algorithm, as discussed in Why is quicksort better than mergesort?.
To simulate a worst case scenario we use a random access pattern. Because of the uniform distribution across the key space, cache2k with Clock-Pro will need a longer scan to find a good eviction candidate. While there can be artificially constructed sequences for a known cache size and internal tuning parameters which might trigger even longer scans, we believe that a random sequence yields the worst eviction performance that can be observed in practice.
Besides evaluating the behaviour of cache2k, a benchmark with a random pattern can be used to verify that caches have comparable eviction policies. When the size parameter is honoured correctly, all caches are expected to produce the same hit rate.
Similar to the benchmark described before, the access sequence is generated by a separate random generator per thread. The fast random sequence generator XorShift1024StarRandomGenerator of the DSI utilities is used for this purpose.
In this case a cache miss gets no extra penalty. As the effective hit rate is identical across cache
implementations, the penalty would only change the performance result by a constant factor. So in this benchmark the performance
is solely determined by the sequence generator and the cache operations.
Whiskers show the 99.9 % confidence interval reported by JMH.
Let’s also verify that the effective hit rate is on the same level:
Whiskers show the 99.9 % confidence interval reported by JMH.
To see how the cache size impacts the performance, let’s look at different cache sizes with constant thread count and hit rate:
Whiskers show the 99.9 % confidence interval reported by JMH.
As we can see, the performance of cache2k is similar to other cache implementations when the cache size is increased.
We also analysed a benchmark run with the new G1 garbage collector:
Whiskers show the 99.9 % confidence interval reported by JMH.
With the new G1 collector all cache implementations show significantly reduced performance when cache sizes are increased. The implementations cache2k and the Google Guava cache have an even higher performance drop for G1. Doing CPU profiling with cache2k reveals that 30-40% of the CPU time is spent in refinement tasks of G1, which is caused by inter region reference updates. This benchmark shows that throughput oriented applications with lots of reference mutations and larger heaps should not choose the G1 collector. The effects of G1 with large cache sizes need to undergo a deeper analysis in case this becomes more relevant in practice.
This is an extreme test scenario to reveal the limits of cache2k. We unintentionally constructed a scenario where the use of the G1 collector has a rather big performance loss. 10 million entries and a cache operating at a hit rate of 50% would be a rare operating condition. Most likely this can be found in throughput oriented applications, which should better choose the CMS collector. Under normal working conditions, as we have shown above, cache2k achieves a performance gain with G1 compared to other cache libraries.
Average Items Scanned in Clock-Pro
As explained above cache2k uses the Clock-Pro algorithm, which scans the cache entries organised in a circular data structure to select the best entry to evict. There is no upper bound on the number of scanned entries in cache2k. In this chapter we investigate how the scan effort changes with the cache size.
When the cache parameters are known, there is a theoretical chance to construct an artificial access pattern that triggers a full scan over all entries. Such an access pattern could be a vector for DoS attacks. But after a full scan all access counters are zeroed, so the attack sequence needs to be repeated and all cached entries need to be covered. The cost of sending and processing the attack sequence would thus be much higher than the damage caused.
Using the internal counters of cache2k, we can extract the average number of entries scanned per eviction. This allows us to get an insight into the different eviction costs under different working conditions. Let’s look at how different cache sizes affect the number of scans:
Whiskers show the 99.9 % confidence interval reported by JMH.
The results are rather surprising. Scan counts are almost equal for the same hit rate for any cache size. Raw values for reference:
- Size 100K: 6.003983263650306
- Size 1M: 6.004637918679662
- Size 10M: 6.004827089682682
The modified Clock-Pro algorithm in cache2k works well: For a worst case access sequence the scan count does not increase significantly when the cache becomes bigger.
For different hit rates the scan counts look like this:
Whiskers show the 99.9 % confidence interval reported by JMH.
The scan count increases for higher hit rates because all the cache contents become ‘hotter’. The amount of additional scanning when hit rates become higher can be tuned by some internal parameters. As we can see with this benchmark, the tuning parameters are chosen in a way that the additional scanning work in the eviction does not outweigh the performance gains of the improved hit rate. With high hit rates cache2k still has less overhead than other cache libraries.
Finally, we will take a look at the scan counts for the first benchmark:
Whiskers show the 99.9 % confidence interval reported by JMH.
For a typical skewed access sequence the average scan count is very low. In the tested scenarios it is below two. For realistic (non-random) access sequences, the experiment shows that the scan count decreases for higher cache sizes. The result of this practical scenario is in contradiction to the theoretical evaluation.
Memory Consumption
For the evaluation of the memory consumption we use the first benchmark (ZipfianSequenceLoadingBenchmark).
The details of the metrics and the measurement procedure were presented in a previous blog post,
The 6 Memory Metrics You Should Track in Your Java Benchmarks.
For concision we concentrate on two metrics only. usedMem_settled represents the used memory
that the JVM reports at the end of the benchmark. This is a static measure and does not take into
account differences in usage when operations are ongoing. The VmHWM metric represents peak memory
consumption as reported by the operating system, thus it also includes dynamic effects like garbage collection.
In the tested scenario cache2k has an 11% higher static memory consumption than Caffeine. In this scenario the payload data (keys and values) consists only of integer objects. With larger data sizes in practical applications, the difference in static memory consumption between the cache implementations would be much lower.
The peak memory consumption differs more drastically. Cache2k achieves a lower peak memory consumption because of its low allocation rates, which lead to less garbage collector activity. Depending on the cache utilisation, cache size and hit rates, the total memory consumption will differ. Here is a rather extreme example with the G1 collector:
Interesting side note: Since cache eviction produces garbage, increasing the cache size could have a dramatic effect on the peak memory consumption and can actually lower the amount of memory needed, as less garbage means the garbage collector needs less breathing space.
Looking only at the static used heap memory can give the wrong idea about the physical memory actually used in operation.
Jar File Sizes
Finally, let’s look at the jar file sizes:
- caffeine-2.5.2.jar: 1.007.339 bytes
- cache2k-all-1.0.0.Final.jar: 387.771 bytes
- cache2k-api-1.0.0.Final.jar + cache2k-core-1.0.0.Final.jar: 321.816 bytes
- ehcache-core-2.10.3.jar: 1.386.653 bytes
- guava-20.0.jar: 2.442.625 bytes
- guava cache only alternative: com.nytimes.android:cache-2.0.3.jar: 160.474 bytes
For Guava cache users who don’t need the whole Guava library, The New York Times has provided a jar file which contains only the cache functionality. For Android or other environments where the download size matters, Guava and cache2k are the best choices. Compared to the others, the Caffeine jar is rather big due to the high number of generated classes.
Benchmark Shortcomings
All of our benchmark scenarios intentionally stress the cache heavily to amplify differences in the cache implementations and reveal weaknesses. The outcome in real applications will be much better.
Here is a summary of noteworthy points that may influence the real world performance:
- The value and key in the benchmark are only integer objects. Larger and more complex objects will lead to higher allocation rates. The overhead in the internal data structures of the cache becomes less significant.
- Different latency and CPU cycles for loading a cache value
- CPU time used by the application
- Interactive or throughput oriented workload
- Selected garbage collector and its tuning values
- Forced full GC between iterations may influence benchmark results
- A real world access sequence is different from the Zipfian sequence
The last point cannot be stressed enough. Testing with the Zipfian distribution is heavily in favour of caches which keep frequently used entries for a longer time (frequency aspect). As the access pattern is always in the same value range, a cache could actually stop replacing entries after a set of hot entries is established. The next benchmarks should modify the value ranges to test the speed of adaptation, e.g. in a phase change of the application.
Running all benchmarks with the CMS and G1 collectors with the needed precision takes four days on one machine. Especially the large cache size of 10M needs longer benchmark run times. Because of the time required for a run, we could only test three variations each of thread count, cache size and hit rate.
Future Work
A lot of work went into this blog post and at this point it is important to publish results rather than to continue digging deeper. This is what we left for the future:
- Use a sweeping Zipfian sequence, to test adaptation speed (see above)
- Benchmarks with a higher number of cores/threads
- Benchmark with latency
- Clock-Pro eviction: Analyse/compare the scan counts with the original algorithm
- Clock-Pro eviction: Deeper analysis of worst case patterns close to 100% hit rate
- Clock-Pro eviction: Capping the eviction scans will reduce computing cost for random access patterns
- Deeper analysis of the interaction with G1, e.g. benchmark runs with a finer variation of cache sizes
- Improve cache2k eviction for the G1 collector
- In general, caching and GC interaction is worth further research, e.g. analysing the balance between cache size and GC activity
Conclusion
Cache2k uses an alternative eviction algorithm (Clock-Pro) that reduces the latency overhead of the cache access to a minimum. After analysing the benchmark results we can see that cache2k has better performance than other caches when operating at high hit rates, approximately above 80%. With lower hit rates, which cause more eviction activity, the performance of cache2k is at least on the same level as other cache implementations.
Since the eviction runtime of the Clock-Pro algorithm could theoretically grow linearly with the cache size, cache2k includes improvements over the original algorithm. Our experiments have proven that the performance of the implementation is stable in the worst possible scenarios. Because of this intensive testing we can say that the implementation has production quality.
As the achieved hit rates show, Caffeine and cache2k both use an effective and modern eviction algorithm that performs better than LRU for the Zipfian sequence.
Because of its low allocation rates, cache2k performs better with the upcoming G1 garbage collector than other caches in typical working conditions.
The memory overhead differs for each cache implementation. When compared to Guava or Caffeine, cache2k has slightly more static memory overhead. However, in high throughput scenarios cache2k can achieve a much lower total memory consumption because of its low allocation rates.
Update 2026: Typo and wording fixes, switch to UK English.